
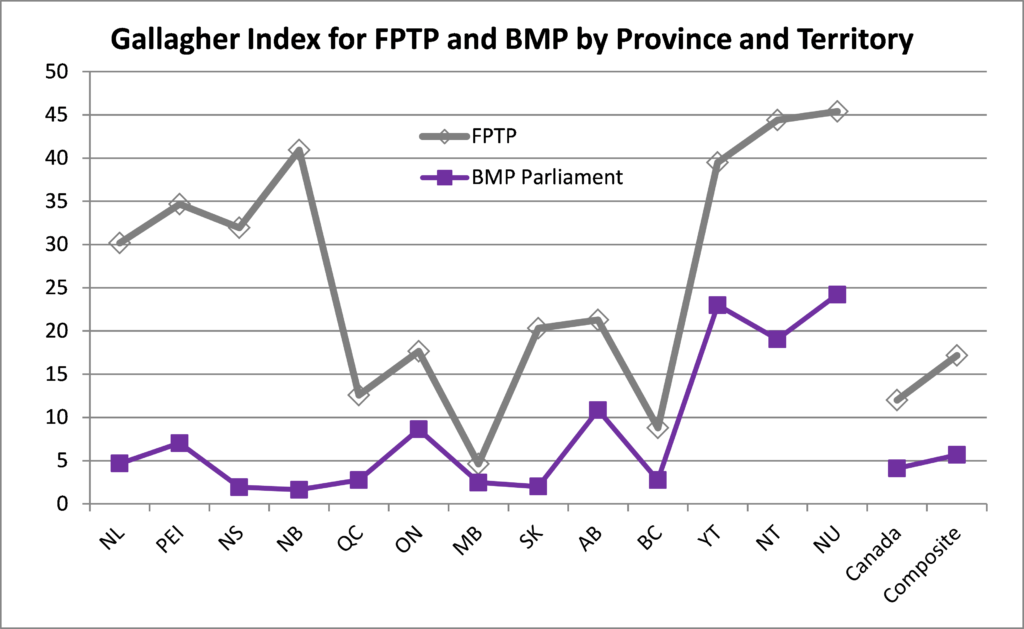
An earlier post discussed the Gallagher Index for a Bicameral Mixed-member Proportional Parliament. It showed that BMP would reduce the index for the current Parliament, elected in 2015 by First-Past-The-Post, from 12.0 to just 4.1. This post looks at the Gallagher Index by province and territory. As you might expect, it can vary widely depending on seat count and the proportionality between vote share and seat distribution. The chart below shows how the Gallagher Index varies across Canada for FPTP and BMP.
 Note two important results:
- The Gallagher Index varies widely across Canada. In general, it is worse for lower seat count provinces and the single-seat territories.
- BMP reduces the Gallagher Index across the country, often substantially. In particular, BMP dramatically improves the Index for the four Atlantic provinces, which were swept by the LPC in 2015. It makes a smaller improvement in Ontario and Alberta because the LPC and CPC respectively are over-represented in the Commons in those provinces due to overhang seats.
The right-hand end of each curve shows the Gallagher Index for Canada as well as the composite index. The latter is an average of the indices by province and territory weighted by seat count to correct for “regional disproportionalities such as the significant over-representation of Conservatives in the Prairies offsetting the over-representation of Liberals in the Maritimes.”[1]
![[1]](http://www.bmp-bpm.ca/blog/more-on-the-gallagher-index-for-bmp/#cite_note-1)
BMP reduces the composite Gallagher Index from 17.1 under FPTP to 5.7. (BMP reduces the composite index for the four Atlantic provinces from a highly disproportionate 34.7 to just 3.1.)
End Notes
- ^ Report of the Special Committee on Electoral Reform, Strengthening Democracy In Canada: Principles, Process and Public Engagement for Electoral Reform, December 2016, at 70.