
The principle of the Bicameral Multi-member Proportional (BMP) Parliament is that the Senate seats be assigned in such a way as to bring the overall proportionality of both houses closer to the popular vote. How would that work in practice? There are two factors to consider:
- How would Senate seats be assigned?
- How would Senate seats be filled?
This appendix will deal with the first issue. To begin with, there is nothing in the methodology below that restricts Senate seats just to parties. An independent or non-affiliated candidate could earn a Senate seat in certain circumstances, such as finishing a close second or just ahead in a tight race for second.
We developed a model to simulate election results under BMP. It considers several factors:
- The model can simulate scenarios in which incumbent Senators remain or in which all Senators are replaced at each election.
- The model uses the Largest Remainder Method to assign seats based on either Hare (Simple) or Droop quotas.
- The model allows a Threshold to be set for the smallest percentage of votes that will be considered in awarding seats.
The data for the last seven federal elections has been used for simulations; however the results of any election (past or predicted) can be included. The following text provides a worked example, using the 2015 federal election results.[1] Results for previous elections are shown in Appendix B.
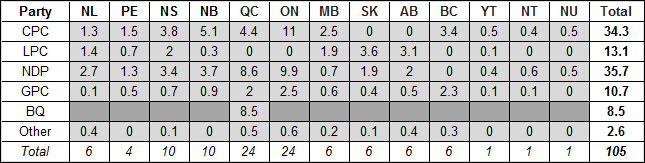
The table below shows the percentage of valid votes by political affiliation and province or territory for the five major parties. Note that the Bloc Quebecois only ran candidates in Quebec. Results for smaller parties and independents are grouped together as “Other” for simplicity, however the methodology can be extended to both.[2]
Table A-1: Percentage of Valid Votes by Political Affiliation for Each Province and Territory
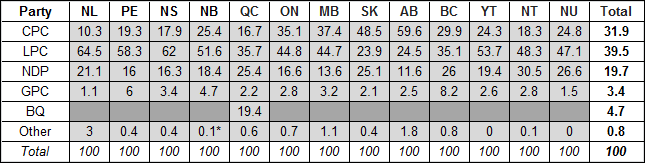
* Elections Canada results for New Brunswick sum to 100.2 due to round-off. More precise results are used in the the simulation results.
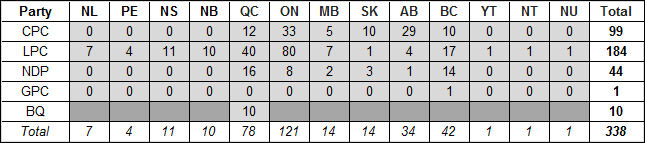
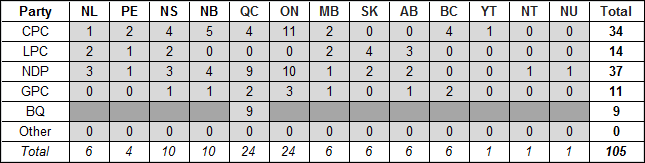
The next table shows the distribution of seats won in the House of Commons by political affiliation in 2015 for each province and territory. No seats were awarded to other parties or to Independents.
Table A-2: Distribution of Seats in the House of Commons by Political Affiliation
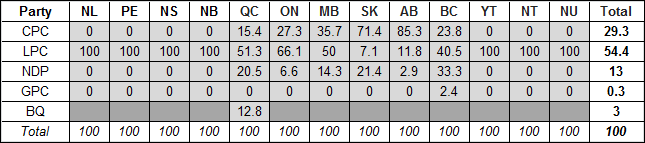
It is well known that the resultant current seat distribution can vary from the popular vote, both overall and regionally. This was particularly striking across Atlantic Canada in 2015 where the Liberals won all 32 seats with between one-half and two-thirds of all votes. The table below shows the proportion of seats held by province and territory. A comparison with Table A-1 shows the extent of the differences.
Table A-3: Actual Proportion of Seats in the House of Commons by Political Affiliation
This is the difference that all proportional representation systems seek to reduce. The BMP system uses the 105 Senate seats to rebalance Parliament overall.[3] The first step, therefore, is to calculate how many seats each party would earn under perfect proportionality, from the combined 443 seats of the Commons and Senate. Since Senate seats are tied to individual provinces and territories, this calculation is performed separately for each. For example, Nova Scotia has 11 MPs and 10 Senators for a total of 21 representatives. Since the Conservatives won 17.9% of the popular vote, they would expect to hold 3.8 seats (17.9% of 21). The complete results are shown below.
Table A-4: Theoretical Total Number of Seats Held in Both Houses by Proportion of the Vote*
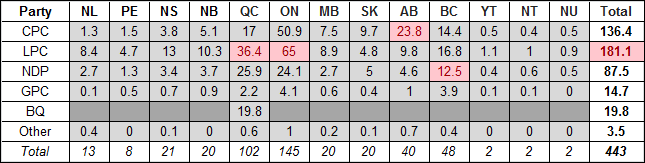
*The red shading in Table A-4 above indicates where there are overhang seats.
Two issues are immediately obvious. First, fractional seats cannot be awarded. Second, a party may have more seats in the Commons than their share of the vote would yield, even after rebalancing with Senate seats. This is quite common in a FPTP system: the red shading indicates such cases in 2015. For example, the vote share in Ontario would award the Liberals with 65 combined Commons and Senate seats, yet they won 80 in the Commons (see Table A-2). The 15 “extra” seats are referred to as overhang. Since seats cannot be taken away, the remaining seats must be shared as proportionally as possible, recognizing that perfect proportionality is impossible.
The first step is to simulate the distribution of the 105 Senate seats. The table below shows the results. Each cell indicates the number of seats a party would receive according to their vote share less any seats already held in the Commons, but scaled to account for any overhang seats in the Commons.
Table A-5: Theoretical Number of Seats Held in the Senate to Match Proportion of the Vote
Consider two examples to illustrate how Table A-5 was determined:
- Nova Scotia: As noted above, the Conservatives would expect to hold 3.8 seats in the two houses. Since they do not hold a seat in the Commons, these would be held in the Senate. The remaining 6.2 Senate seats are apportioned similarly among the other parties.
- Ontario: The Conservatives would expect to hold 50.9 combined seats. Since they won 33 in the Commons, they would expect another 17.9 in the Senate. As previously stated, the Liberals have overhang seats in the Commons. Although they should only receive 65 combined seats, they already hold 80. Since negative seats cannot be assigned, the fewest they can be assigned is zero. But, that does not solve the dilemma, because the other parties are now short-changed by the 15 seat overhang. That is, they cannot be awarded as many seats as proportion dictates, because 15 extra seats have been taken. The other parties must therefore share the 24 Senate seats available in Ontario as best they can, even though they are “short” in the Commons. This is done by scaling their assigned seats in proportion. As a result, the Conservatives are assigned 11, and the other parties get correspondingly smaller fractions.[4]
Since fractional seats cannot be awarded, the first step is to award any integer seats (i.e., the whole number portion of those in Table A-5). For example, in Nova Scotia, the Conservatives, Liberals and New Democrats would be awarded three, two and three seats respectively,[5] leaving two seats unassigned. A common approach in proportional systems is to assign any remaining seats to those parties that have the largest remainder (i.e., the largest fractional seat). Continuing the example, the largest fractions are 0.8 for the Conservatives and 0.7 for the Greens, so they receive the two remaining seats, leaving the Conservatives with four in total.
Repeating this exercise for each province and territory results in the following Senate distribution for a Bicameral Mixed-member Proportional Parliament.
Table A-6: 2015 Distribution of Seats in a Bicameral Mixed-member Proportional Senate
The table above and the pie chart below that the Conservatives and New Democrats dominate the resulting Senate. The Liberals are the third party, which offsets their dominance in the Commons.
Figure A-1: 2015 Composition of the BMP Senate by Party Affiliation
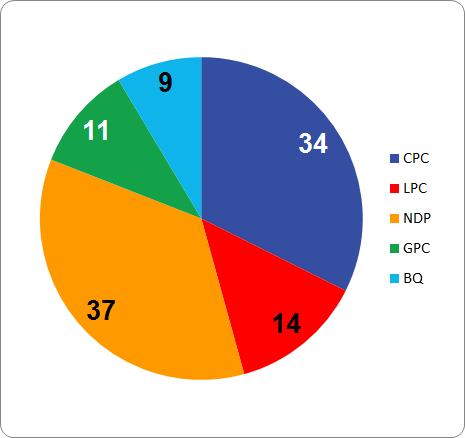
The Greens, with low but nationwide support, earn 11 seats on top of the one earned outright in the Commons. The Bloc, with strong but concentrated support, earn 9 seats on top of 10 in the Commons.
The real measure of success for BMP is in how well it can balance the overall Parliament. The charts below compares the share of seats in the Commons, the BMP Senate and the overall BMP Parliament to the popular vote.
Figure A-2: What the Overall BMP Parliament Would Look Like Compared to the 2015 Popular Vote
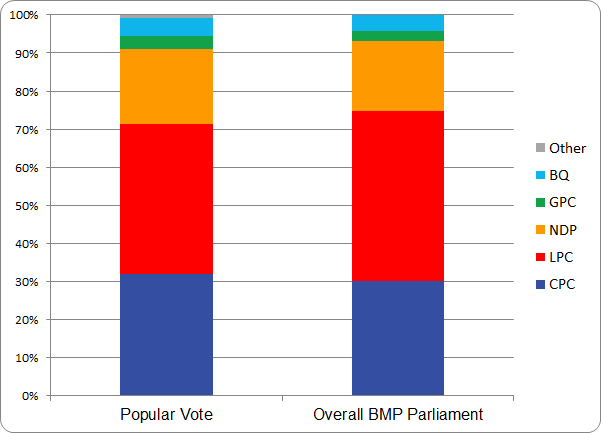
Figure A-3: Comparison of the House of Commons, Senate and Overall BMP Parliament to the 2015 Popular Vote
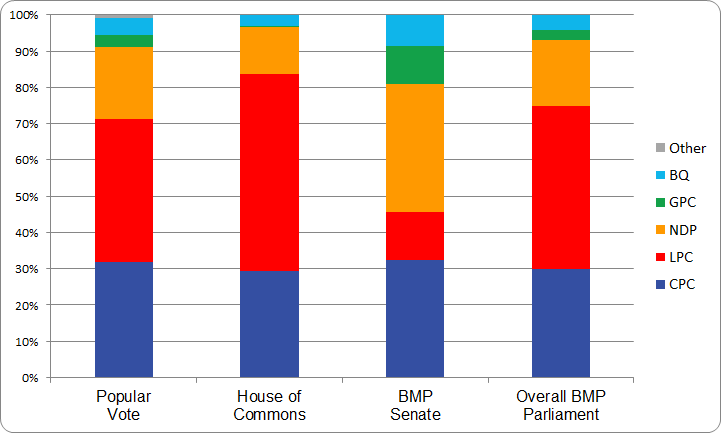
In striving for proportional representation, the Vote is the standard of comparison. It is clear that the Liberals dominate the Commons, holding 54.4% of the seats on 39.5% of the vote. The BMP Senate is therefore weighted towards the other parties that are underrepresented in the Commons, by province or territory. The resulting combined BMP Parliament (shown in the right-most column) is much closer to the popular vote even though the Senate’s 105 seats represent less than one-quarter of the total. Table A-7 provides the numerical values and confirms that BMP does improve the balance, bringing the total seat count of all parties closer to the vote.[6]
Table A-7: Comparison to the Electoral Vote
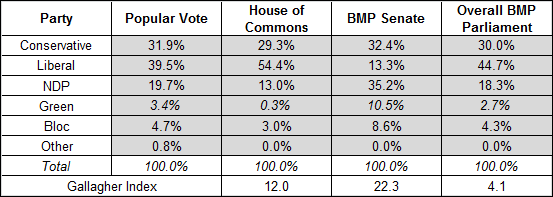
The Gallagher Index, shown in the bottom row, is a measure of the proportionality of an electoral outcome, on a scale from 0 (indicating perfect proportionality) to 100. A BMP Parliament reduces the index from 12 to 4.1.
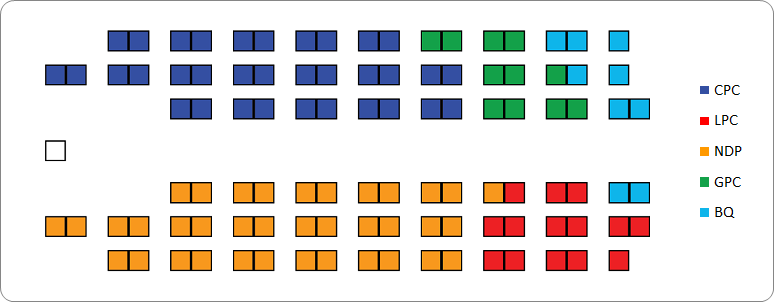
So the BMP Senate might look like this:
Figure A-4: A BMP Senate with Seats Coloured by Affiliation
| Overview | Appendix A | Appendix B | Appendix C | Appendix D |
End Notes
- ^ Parliament of Canada, Elections, (Ottawa: Library of Parliament database, n.d.), online: Parliament of Canada (last visited 5 October 2016).
- ^ For the purpose of these simulations, the next best performing party and the best performing individual were included in the analysis to check if either would win a seat.
- ^ The issue of incumbent Senators is dealt with in Appendix D.
- ^ Specifically, since the total overhang in the House of Commons for Ontario is 15 seats, the party shares are scaled by 24/(24+15) or about 0.61.
- ^ Given that the Liberals won all the House of Commons seats in Nova Scotia, they might not be expected to win any Senate seats; however their very strong 62% of the popular vote corresponds to 13.0 of the 21 seats.
- ^ BMP reduces the Liberal proportion to 44.5%, which is still 5% above the vote due in large part to the 15 seat overhang in Ontario, as discussed in Table A-4.