
The principle of the Bicameral Mixed-member Proportional (BMP) Parliament is that the Senate seats be assigned in such a way as to bring the overall proportionality of both houses closer to the popular vote. How might that look? We can get an idea by applying BMP to past elections. It is important to remember that a change in voting system will affect the way people vote, and so the results shown here should be considered simulations only. BMP might reduce strategic voting and it might increase voter turnout, if Canadians conclude that their vote will have more impact on shaping Parliament.
Each section below shows the simulated Senate composition by Province or Territory, and compares that to the electoral vote, for the six elections prior to 2015. (The corresponding results for 2015 are shown in Appendix A, Table A-6 and Figure A-2.) All results use the Simple (Hare) quota and no Threshold. Although smaller parties and independents are grouped together as Other in the tables, the simulations considered the next best performing party and the best performing individual to check if any would earn a BMP Senate seat.
Simulated BMP Results for 2011 Federal Election
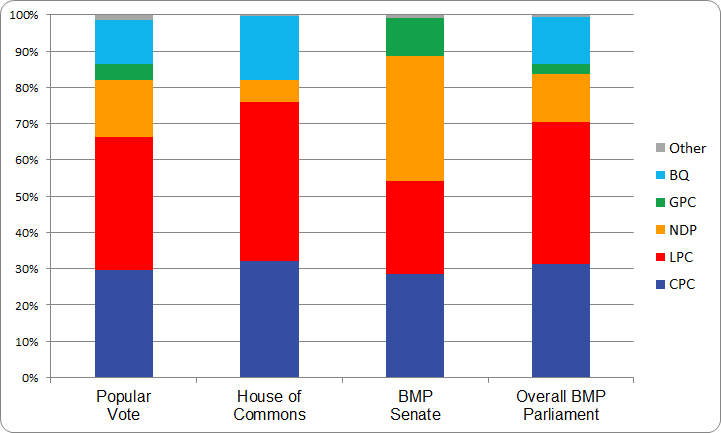
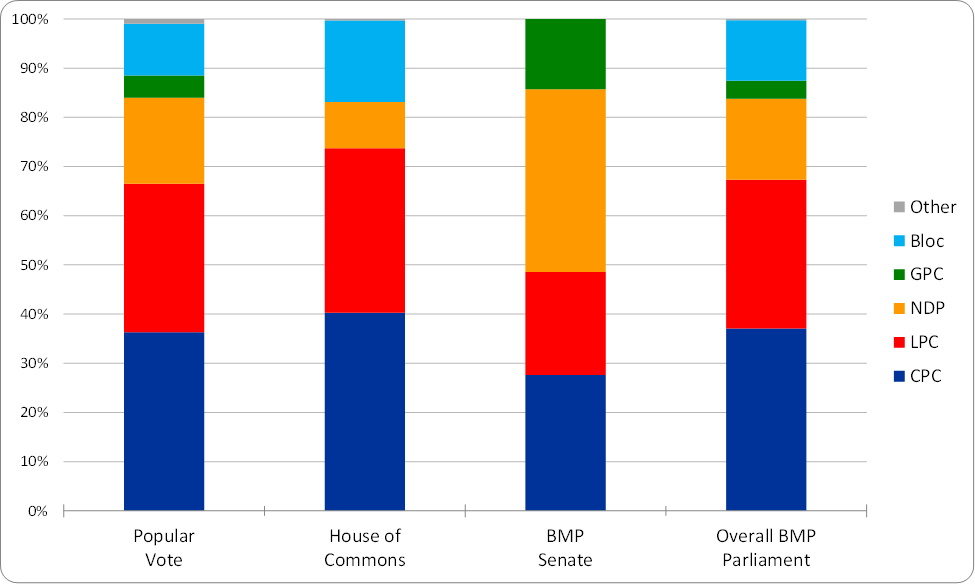
In 2011, the Conservatives won a majority of 166 seats with 39.6% of the vote. The New Democrats formed the Opposition with 103 seats from 30.6% of the vote. The Liberals were reduced to 34 seats and the Bloc to just four, while the Greens won their first seat.
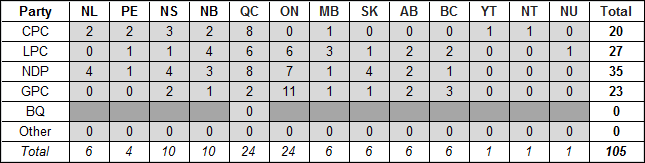
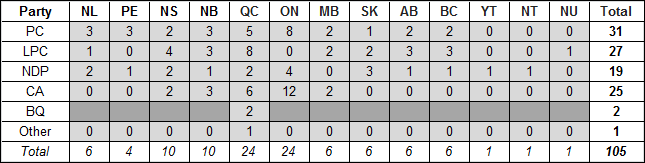
Table B-1: 2011 Distribution of Seats in a Bicameral Mixed-member Proportional Senate

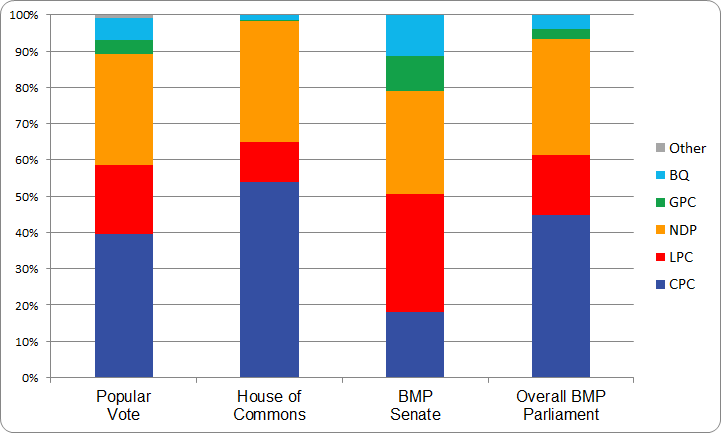
In 2011, a BMP Senate would have been dominated by Liberals and New Democrats, each with almost one-third of the seats, offsetting to some degree the Conservative majority in the Commons. Even so, the Conservatives would have won one-fifth of the seats, primarily in Atlantic Canada. The Bloc would have won 12 seats, reflecting their continued strength in the vote, despite their decline in the Commons. Until 2011, the Commons had 308 seats. As a result, the Senate would have had slightly more influence in a BMP Parliament, accounting for 25.4% of the seats (105 / 413).
Figure B-1: 2011 Comparison of the Commons, Senate and BMP Composition to the Vote
Simulated BMP Results for 2008 Federal Election
In 2008, the Conservatives won a strong minority of 143 seats with 37.7% of the vote. The Liberals formed the Opposition with 77 seats, the Bloc won 49 and the New Democrats 37.
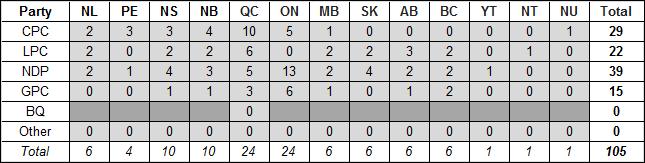
Table B-2: 2008 Distribution of Seats in a Bicameral Mixed-member Proportional Senate
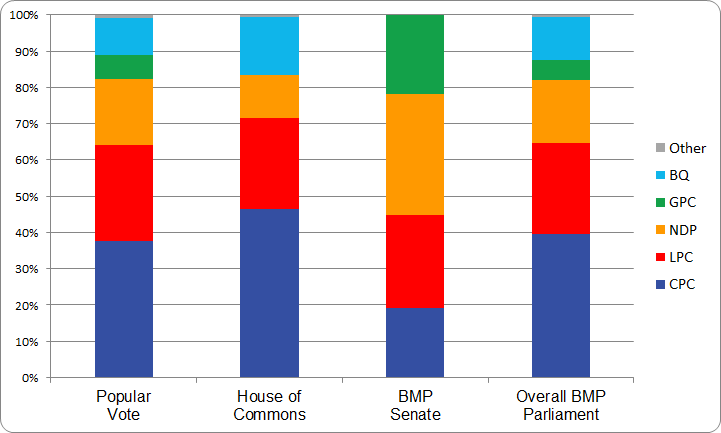
In 2008, a BMP Senate would have been one-third New Democrat and one-quarter Liberal, with Conservatives and Greens holding about one-fifth each. The latter would have had 22 seats due to winning almost 9% of the electoral vote, but no seats in the Commons. By contrast, the Bloc would have received no Senate seats, since their 49 seats in the Commons exceeded their proportion of the vote.
Figure B-2: 2008 Comparison of the Commons, Senate and BMP Composition to the Vote
Simulated BMP Results for 2006 Federal Election
In 2006, the Conservatives won a weak minority of 124 seats with 36.3% of the vote. The Liberals formed the Opposition with 103 seats, the Bloc won 51 and the New Democrats 29.
Table B-3: 2006 Distribution of Seats in a Bicameral Mixed-member Proportional Senate
In 2006, a BMP Senate would have been more than one-third New Democrat, and more than one-quarter Conservative. Liberals would have held one-fifth and the Greens about one-seventh. The latter would have 15 seats due to winning 4.5% of the electoral vote, but no seats in the Commons. By contrast, the Bloc would have received no Senate seats, since their 51 seats in the Commons exceeded their proportion of the vote.
Figure B-3: 2006 Comparison of the Commons, Senate and BMP Composition to the Vote

[The image above was updated on 1-Jan-2017 to correct small errors in the Popular Vote.]
Simulated BMP Results for 2004 Federal Election
In 2004, the Liberals won a moderate minority of 135 seats on 35.7% of the vote. The renamed Conservatives formed the Opposition with 99 seats, the Bloc won 54 and the New Democrats 19. In 2004, the Commons grew by seven seats to 308.
Table B-4: 2004 Distribution of Seats in a Bicameral Mixed-member Proportional Senate

In 2004, a BMP Senate would have been one-third New Democrat and more than one-quarter Conservative. Liberals would have held one-fifth. The Greens would have won 10 seats on the strength of 4.3% of the electoral vote, despite no seats in the Commons. By contrast, the Bloc would have received no Senate seats, since their 54 seats in the Commons exceeded their proportion of the vote. Interestingly, Manitok Thompson, an Independent teacher from Rankin Inlet who finished second with 16% of the vote, would have won the Senate seat for Nunavut under BMP, just beating the NDP and Conservative candidates (with 15% and 14% respectively).
Figure B-4: 2004 Comparison of the Commons, Senate and BMP Composition to the Vote
Simulated BMP Results for 2000 Federal Election
In 2000, the Liberals won a strong majority of 172 seats on 40.8% of the vote. The Canadian Alliance party formed the Opposition with 66 seats, the Bloc won 38, the New Democrats 13 and the Progressive Conservative were reduced to 12.
Table B-5: 2000 Distribution of Seats in a Bicameral Mixed-member Proportional Senate
In 2000, a BMP Senate would have been quite evenly divided between Progressive Conservatives, Liberals and the CRCA, each with just over one-quarter of the seats, with the New Democrats not far behind. In Quebec, the Bloc would have won two seats while the Marijuana party would have won one with 1.03% of the vote. For 2000, the Senate grew by one seat for the newly formed territory of Nunavut.
Figure B-5: 2000 Comparison of the Commons, Senate and BMP Composition to the Vote*
* The Canadian Alliance party colours were green and blue. It is shown here in green to better differentiate it from the Progressive Conservatives and Bloc.
Simulated BMP Results for 1997 Federal Election
In 1997, the Liberals won a slim majority of 155 seats on 38.5% of the vote. The Reform Party broke through to form the Opposition with 60 seats, while the Bloc won 44, the New Democrats 21 and the Progressive Conservative just 20.
Table B-6: 1997 Distribution of Seats in a Bicameral Mixed-member Proportional Senate
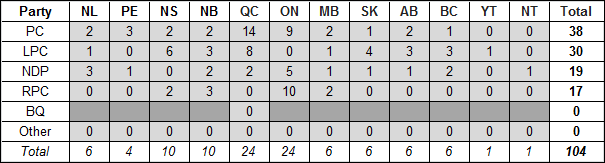
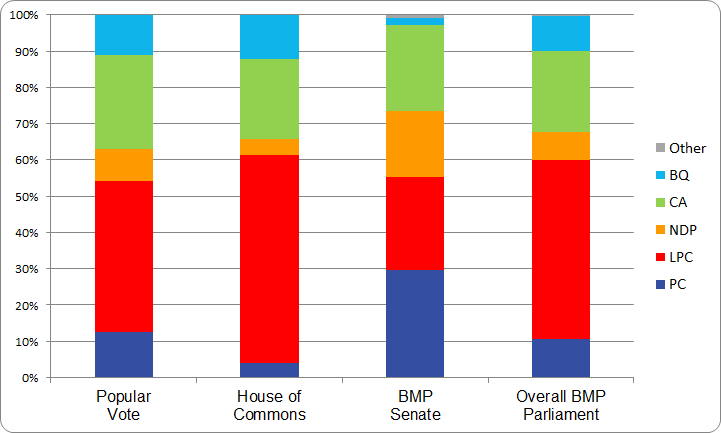
In 1997, a BMP Senate would have been one-third Progressive Conservative, reflecting their popularity at the polls despite their fall in the Commons. The Liberals would have held one-quarter of the Senate and the New Democrats and Reform almost one-fifth each. By contrast, the Bloc would have received no Senate seats, since their 44 seats in the Commons exceeded their proportion of the vote.
Figure B-6: 1997 Comparison of the Commons, Senate and BMP Composition to the Vote
[The image above was updated on 1-Jan-2017 to correct small errors in the Popular Vote.]
To see more on what the distribution of seats in Parliament would look like under the BMP system, compared to the current system, see our Past Elections Results page.
| Overview | Appendix A | Appendix B | Appendix C | Appendix D |