
The simulations above incorporate several assumptions which can affect the outcome. As always, details matter. This appendix investigates some of these assumptions in order to show how much or how little it can affect the results. The biggest effect of all relates to the treatment of incumbent senators, which is discussed in Appendix D.
Quota
A quota is the number of votes required to win a seat in a voting system. In our current FPTP system there is no fixed quota, since the candidate with the largest number of votes wins. If there are only two candidates, then the quota is effectively 50% of the votes, plus one. For three or more candidates, the quota is in effect one more vote than any other candidate.
In a proportional representation system, the quota is determined by the number of seats being considered for a given region. Under BMP, that number is the sum of the Commons and Senate seats for the province or territory of interest; e.g. in Newfoundland and Labrador it is seven and six respectively, for a total of 13.
Since the number of votes is unknown, and incidental to the method, the BMP simulations calculate quota in percentage of the (valid) votes cast. The easiest way to determine quota therefore is to divide the total valid votes (100% by definition) by the available seats (13 in this case), from which it follows that winning more than 100 / 13 = 7.7% of the vote should win a seat. Given the vote share, the seats can be assigned to the parties, as described in Appendix A. This approach to calculating quota is called the Hare or Simple quota, and is calculated as 100% / n, where n is the number of seats. The Hare quota has been used throughout Appendices A and B.
Now consider the case of a two-seat region. If there are more than two candidates, it is unlikely that one will win more than 50% of the vote; nor is it necessary to win a seat. In a two-seat region, more than one-third of the vote is sufficient (although not necessary) to win a seat, since only one other candidate could have more than one-third of the vote. For example, three candidates could win 51, 34 and 15% or 36, 34 and 30% of the vote, with the first and second placed candidates exceeding one-third of the vote. You can imagine a more extreme division of 51, 25 and 24 in which the second candidate just edges out the third despite not winning one-third of the seats. However it should be clear that one-third of the votes is sufficient to win one seat in a two-seat region.
This insight leads to the Droop quota, and is defined here as 100% / (n + 1).[1] Continuing the example of Newfoundland and Labrador, it follows that winning more than 100 / (13 + 1) = 7.14% of the vote should win a seat.
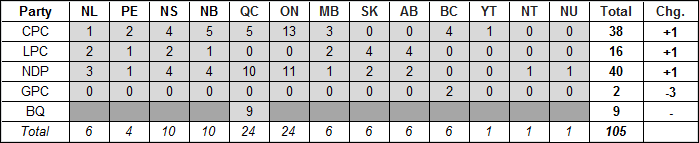
The results below show the 2015 election results using the Droop quota instead of the Hare quota used in Appendix A (see Table A-6 and Figure A-2).
Table C-1: 2015 Distribution of Seats in a BMP Senate Using the Droop Quota
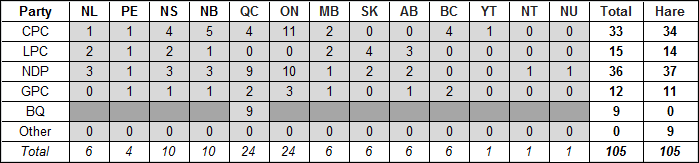
The Droop quota leads to slight differences in the assignment of seats, depending on the results of individual elections. Consider Prince Edward Island, which has four Commons and four Senate seats. Using the Hare quota, the Conservatives, Liberals and New Democrats would have won two, one and one Senate seats respectively. Using the Droop quota, the four seats are evenly split between the four largest parties. The following tables show the differences. The table columns are defined as follows:
- Party: Self-explanatory;
- Vote: Percentage of the valid electoral polls;
- Commons: Seats won;
- Quota Seats: Vote divided by quota (i.e. 12.5% for Hare or 11.1% for Droop);
- Preliminary: Proportional seats less any seats one in the Commons (scaled by the number of available seats in the Droop case);[2]
- Initial: Whole number portion of the seats (which assigns first round of seats);
- Remainder: Fraction, with rank in parentheses, which determines the assignment of any remaining seats;
- Second: Distribution of remaining seats based on largest remainder;
- Final: Sum of Initial and Remaining seats.
Table C-2 shows the detailed calculations using the Hare quota (see Appendix A). The eight seats would ideally be split as shown in the ‘Quota Seats’ column. Subtracting the four Commons seats, all of which were won by the Liberals, leaves the Senate seats to be divided as shown in the ‘Preliminary’ column. The Initial round of ‘integer’ seats are therefore awarded to the Conservatives and New Democrats. This leaves a fraction as shown (and ranked) in the ‘Remainder’ column. The two remaining seats are therefore awarded to the two parties with the largest remainder, which awards a Senate seat to the Liberals and another seat to the Conservatives.
Table C-2: 2015 Distribution of Seats for Prince Edward Island in a BMP Senate Using the Hare Quota
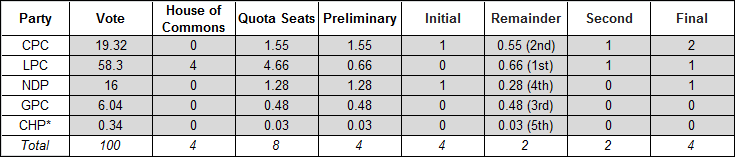
* CHP is the Christian Heritage Party, for which one candidate ran in one riding.
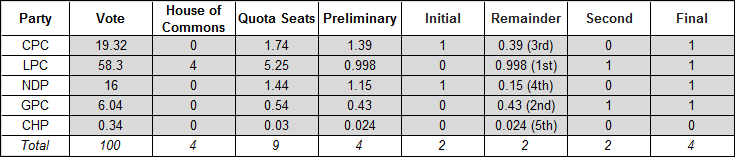
Table C-3 repeats the calculations using the Droop quota. Note that the smaller quota (11.1% vs 12.5%) gives the Liberals 5.25 quota seats instead of 4.66; however the total adds to nine, which is one more than the eight seats available.[2] Subtracting the four Commons seats and scaling the result by 8/9 leaves the Senate seats to be divided as shown in the ‘Preliminary’ column. The Initial round of ‘integer’ seats are again awarded to the Conservatives and New Democrats. This leaves a fraction as shown (and ranked) in the ‘Remainder’ column. In this case, the two remaining seats are awarded to the Liberals (again ranked first) and the Greens (now ranked second).
Table C-3: 2015 Distribution of Seats for Prince Edward Island in a BMP Senate Using the Droop Quota
The choice of quota will affect results, but should have no bearing when assessing the suitability of the Bicameral Mixed-member Proportional system for Canadian federal elections.
Threshold
A threshold can be set for the smallest percentage of votes that will be considered in awarding seats. This is usually done to establish a minimum standard of support required at the polls in order to obtain a seat, and is sometimes invoked as a means to prevent so-called “fringe” parties. Before discussing the effect of thresholds, it is important to point out that BMP includes an inherent “soft” threshold, which varies by province and territory, as a function of the seats available.
Soft Threshold
For example, as noted earlier, Newfoundland and Labrador have 13 total seats, which means that 7.7% of the vote for any party will guarantee a seat in the Senate, if not won outright in the Commons. However, because of the two-stage process in assigning Senate seats, some seats can be won on less than this seat-based quota (as discussed above), depending on the remainder (see Appendix A). The exact threshold will vary depending on the vote distribution, but on average we can expect a soft threshold approximately equal to one-half the seat-based quota.[3]
Some idea of the role of this soft threshold can be obtained by looking at the simulations. Table C-4 shows the percentage of the vote for Other that would have been awarded a Senate seat under BMP in the last seven federal elections, had all those Other votes been cast for a single candidate or party (in practice, they are usually divided among several parties and/or independent or non-affiliated candidates). The table lists the quota (i.e. 100% / n, where n is the total number of seats), followed by the percentage of the vote for Other for each election, by year. Instances that would have won a BMP Senate seat are shown in bold.
Table C-4: Percentage of “Other” Vote That Would Win a Seat in BMP Senate Simulations
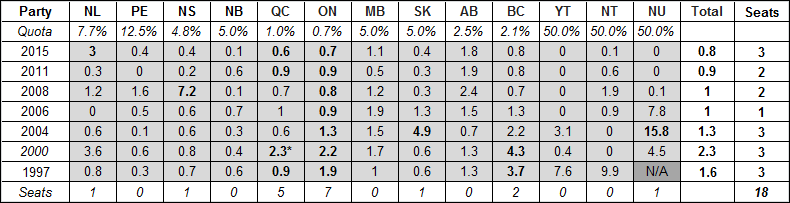
* Note: the 2.3% of the vote in Quebec in 2000 would have won two seats for Other candidates if evenly split.
Only eighteen such seats would have been awarded over seven elections (out of 734, or 2.5% on average). Two-thirds of these would have been in Quebec and Ontario, which is expected as they have the most seats and therefore the lowest quota (1.0 and 0.7% respectively). It can be seen that a vote close to or above the quota is typically needed. As noted above, these results combine all votes for Independent and Other party candidates and therefore represent a maximal case for “Other” wins.
However two of the cases above correspond to actual wins by smaller parties or Independents:
- The 2004 result for Nunavut is particularly interesting. The 15.8% was cast for a single Independent candidate, Manitok Thompson, a teacher from Rankin Inlet—who would therefore have won the Senate seat under BMP—just beating the NDP and Conservative candidates (with 15.2 and 14.4% respectively).
- The 2000 result in Quebec would have awarded a seat to the Marijuana Party, based on 1.03% of the popular vote, which is close to the seat-based quota (Quebec has 75 + 24 = 99 seats).
Hard Threshold
Nevertheless, a formal, or “hard”, threshold can be easily implemented in a BMP Parliament. The tables below compare the results with thresholds of 1%, 3% and 5%. In each case, parties that have a vote share less than the threshold are removed from contention, and the BMP simulation recalculated for the remaining parties out of their total vote.[4] First, the results with no threshold from Table A-6 are repeated in Table C-5 for reference.[5]
Table C-5: 2015 Distribution of Seats in a BMP Senate: No Threshold
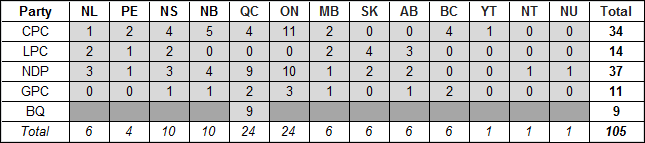
Table C-6 shows the results with a 1% threshold. There are no differences from the inherent soft threshold.
Table C-6: 2015 Distribution of Seats in a BMP Senate: 1% Threshold

Table C-7 shows the results with a 3% threshold. The additional change with respect to 1% threshold is shown in bold in the rightmost column.
Table C-7: 2015 Distribution of Seats in a BMP Senate: 3% Threshold

The Greens lose 6 seats to the larger parties as their vote share in several provinces is below 3%, despite earning multiple seats without a hard threshold. The impact of a further increase in threshold to 5% is shown in Table C-8.
Table C-8 shows the results with a 5% threshold. The additional change with respect to 3% threshold is shown in the rightmost column.
Table C-8: 2015 Distribution of Seats in a BMP Senate: 5% Threshold
The Greens lose three further seats, and are reduced to a pair in their strongest province, British Columbia, plus their Commons seat.
It is clear that an increasing threshold hurts a party such as the Greens with nationwide but modest support, whereas the Bloc, being a regional party with concentrated support, preserves its Senate seats under BMP.
It is worth noting that in the MMP system of New Zealand, a party winning an “Electorate” seat (equivalent to electing an MP to the Commons under BMP), is automatically treated as surpassing the threshold. In Germany, the same treatment is given to parties winning three constituency seats. This approach could easily be incorporated into a BMP system.
| Overview | Appendix A | Appendix B | Appendix C | Appendix D |
End Notes
- ^ The definition in Wikipedia adds 1 to this value because it is a quota defined in absolute votes which must be equalled. When working in percentages (which are fractions), it is equivalent to defining the quota as a number to be exceeded. (Strictly speaking, using the Droop quota as calculated here is also known as the Hagenbach-Bischoff quota, however these subtleties are beyond the scope or intent of this appendix.)
- ^ Recall that the Droop quota divides the vote by n+1. This looks like an “extra” seat in the sum of quota seats. Scaling, in this case by 8/9 (i.e. n/(n+1) ) corrects for this.
- ^ One-half because that corresponds to one-half the vote in the district. Consider a tight two way race in which the vote is split 51% to 49%. The former wins the right to represent the district in the Commons, but the second clearly has strong local support, which would likely be sufficient to win one of the BMP Senate seats. A vote share lower than half could win a BMP seat, but with diminishing odds, depending on the overall distribution of the vote in the region.
- ^ For example, if a threshold of 3% is used, and one party only won 2%, it is removed and the BMP simulation normalizes the remaining party votes over their 98% vote share.
- ^ Note that no smaller parties or independents would have won a Senate seat in 2015 under BMP. The best small party performance was by the Libertarians in Alberta, with 0.5% of the vote. The best independent performance was by Scott Andrews in Newfoundland and Labrador. His 17.8% of the vote in Avalon corresponds to 2.9% of the total provincial vote and would have narrowly missed winning the sixth and final Senate seat under BMP.